
DataHub x Databricks: How to Set Up a Data Catalog in 5 minutes
DataHub Community
Data Engineering
Community
Open Source
Databricks


DataHub Community
Data Engineering
Community
Open Source
Databricks
Original post written by Imane Lafnoune of Sicara.
Data discovery is a new pillar of the modern data stack. It provides an inventory of all your data assets to help you discover, understand and manage them. In this article, I will define what is a data catalog before sharing how you can set up DataHub, an open-source data cataloging tool, on your own Databricks Cluster.
Introduction
In the majority of data projects nowadays, diverse data teams have to coexist (data analysts, data engineers, data scientists…) and handle together large-scale data warehouses. The data is often updated in real-time and is shared among multiple data sources. As tools, contributors and use cases multiply in the same organization, pipelines get more complex and prone to failure.
Nonetheless, the solution to this problem lays in data observability or data discovery. It refers to monitoring the health of an organization’s data assets: from ingestion through storage to analysis and reporting. This allows teams to detect issues early on before they impact users or business operations. Barr Moses, the co-founder and CEO of Monte Carlo, wrote an interesting view on the subject in her article about Data Observability:
No matter how advanced your analytics dashboard is or how heavily you invest in the cloud, your best laid plans are all for naught if the data it ingests, transforms, and pushes to downstream isn’t reliable. In other words, “garbage in” is “garbage out.” — Barr Moses
Why do you need a data catalog?
In this data-driven world, the data catalog becomes a central point of reference for all data assets: from files to tables, from schemas to views.
It allows teams to quickly search for specific datasets and provides access to all related metadata: descriptions about how the dataset was created or modified, who is responsible for it and when, what are its dependencies… In other words, it helps teams gather everything related to the dataset all in one place. There are two key issues that have recently brought data observability tools to the center stage:
- The data pipelines, in charge of moving data from one system to another, have become extremely complex. As data manipulation tools multiply, data pipelines run with a higher number of interconnected parts. Data is more likely to break throughout the pipelines, and it becomes harder to locate where failures occur or understand how to fix the problems. As a result, data engineers spend days trying to locate data issues, and levels of trust in the data plummet across organizations; Let’s say for instance that you change the schema of a table in your data-warehouse, you can make sure that your pipelines are running correctly in the data-warehouse but without having a proper view of the lineage in your dependent systems, you have a high chance of breaking your Business Intelligence reports.
- The number of datasets in organizations grows exponentially, documentation becomes a demanding task. It is simply impossible to manually document thousands of tables and millions of columns. Consequently, data users spend more time trying to find and understand data than producing value-generating data analysis.

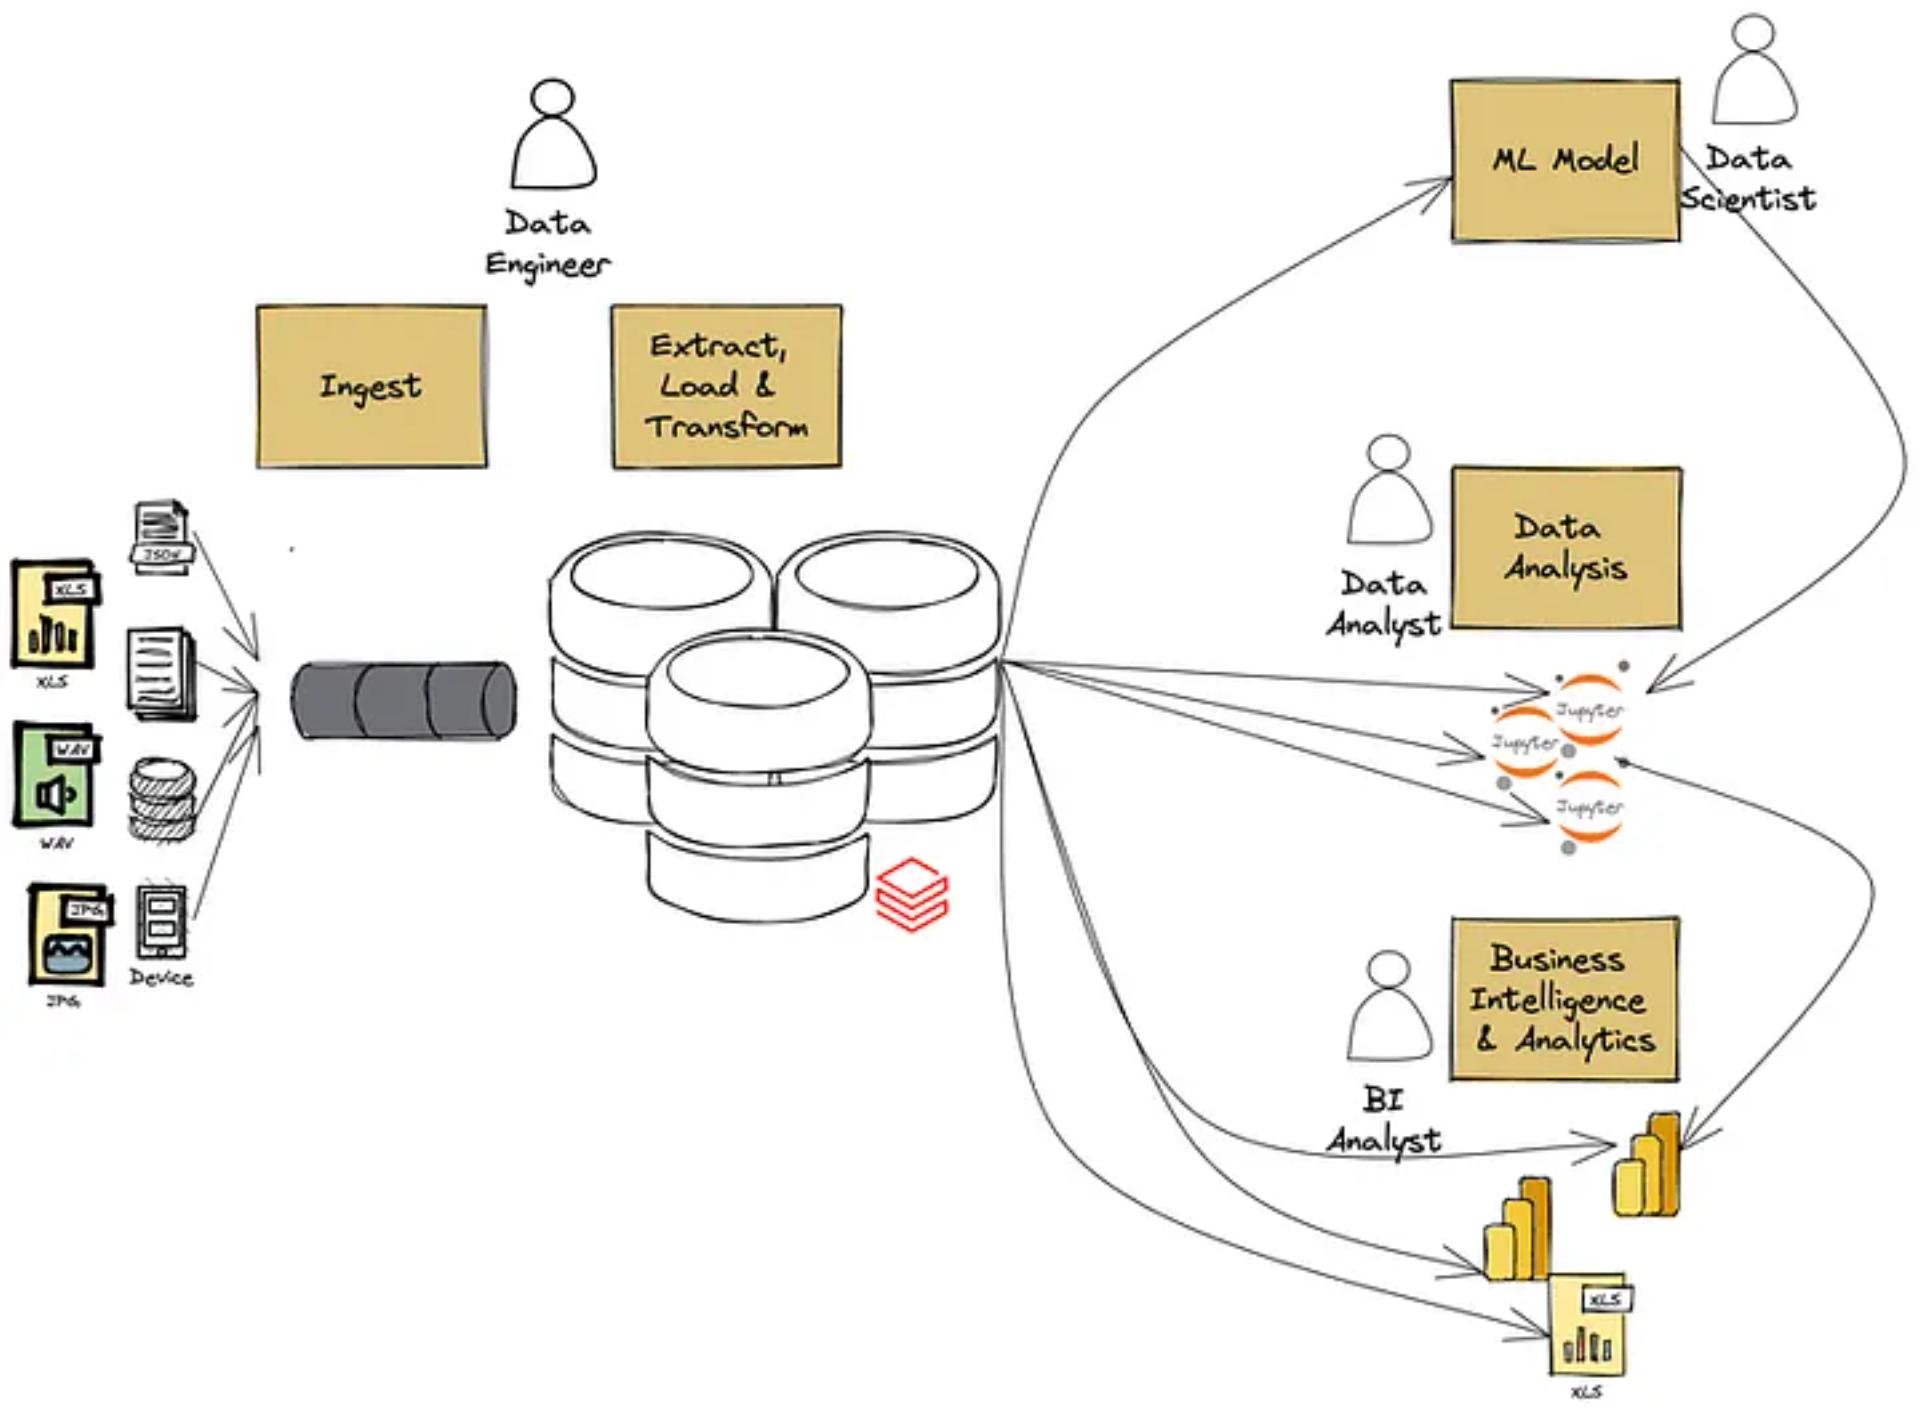
Diverse data teams with large-scale data warehouses
What is a data catalog ?
The data catalog can be defined as a data-governance tool that collects and manages metadata, is a solution to this problem. The Atlan Guide defines the core capabilities of data catalogs as the following:
- Discovery: Ability to search for a given data asset in the metadata, the lineage, the glossary
- Knowledge: Documentation of the data assets and the columns of a table via tags, history, business glossary
- Trust: Data Quality checks to monitor the health of your data, either using manual rules or an automatized tool
- Collaboration: Cooperation via an easy workflow, comments, ownership of datasets or shared queries
- Governance: Control of access policies and restrictions based on roles in the organization
- Security: Personal data protection and integration of an Active Directory
DataHub: an open-source data-catalog
Now that we have a grasp on the importance of a data catalog and its definition, I will deep-dive in a specific data cataloging tool; DataHub.
What is DataHub, and how does it work?
DataHub is an open-source tool that was first developed by LinkedIn in 2019, and it was introduced two weeks after Lyft announced the release of Amundsen. This was actually their second attempt at building a data catalog. After their initial release of WhereHows in 2016, they discovered its scaling limitations and broke its monolithic architecture into multiple stacks.


High-level architecture of DataHub from the official documentation
The current features of DataHub
Let’s see how DataHub integrates the core capabilities of a data catalog:
- Discovery: A global search engine thanks to their Metadata Store (DataHub serving in the schema above) that sits on top of “a Spring Java Service hosting a set of Rest.li API endpoints, along with MySQL, Elasticsearch and Kafka for primary storage and indexing”.
- Knowledge: Document the tables and the different data assets with tags, glossary terms and domains.
- Trust: DataHub supports Great Expectations and can capture data validation outcomes.
- Collaboration: As stated in the documentation, it is possible to integrate the changes in the data catalog with the internal workflow using The Actions Framework.
- Governance: Control the access to data with users, privileges, groups and access policies.
- Security: Support of OpenID Connect authentication to use third party systems like Azure Authentication, OKTA or Google Authenticator.
How to set up DataHub with Databricks
- [Disclaimer] Installation on Apple M1, macOS Monterrey
- [Disclaimer] All these steps have been tested on a high-concurrency Databricks cluster
Databricks is a data lake-house that combines data warehouses and data lakes into one platform to handle not only the data, but also analytics and Machine Learning models. Founded in 2013, it gained a lot of traction in the last few years. In a project for an actor in the energy sector, we aimed to allow the customers to understand their energy consumption in real-time. Therefore, we created an ETL in Databricks to process data that we received directly from multiple IoT sensors. We then used this data to feed the client’s platform and various dashboards. Thus, we needed a data catalog to monitor the metadata in our various steps. In this section, we will define how to set up DataHub with a ready to use Databricks instance.
Quick-start to DataHub using docker
Pre-requisites:
- docker with at least 2 CPUs, 8 GB RAM, 2 GB Swap area, and 10GB disk space
- Python 3.7+
Given that this installation was for Proof Of Concept purposes, we followed the steps described in detail in the quick-start guide:
- Launch Docker
- Install the DataHub CLI
- Deploy a DataHub instance locally using the command: ‘datahub docker quickstart’ or if you are on an M1: ‘datahub docker quickstart --arch m1’
- Test that your configuration is running correctly by ingesting sample data
Using DataHub with Databricks
Pre-requisites:
- Admin access to the cluster
- A configured Databricks CLI and Databricks connect
- Download the dataHub-spark-lineage jar artifact from the maven repository as specified in the official documentation
Configure the Databricks dbfs
- Create an init.sh file containing the following content


Set-up of the init file
- Copy the jar file and the init.sh file to the Databricks dbfs using the commands below

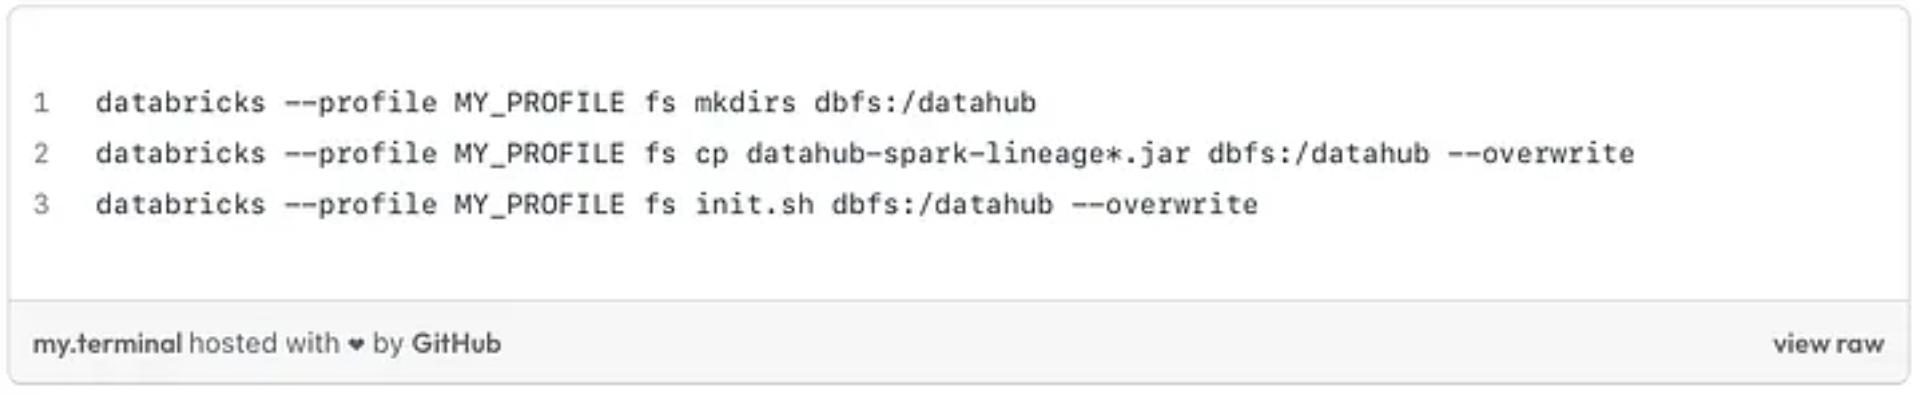
CLI commands to run in your terminal
Configure the Databricks cluster
As stated in the official Databricks documentation, you can fine tune your spark jobs according to your needs. In the spark config field, you should add the following elements:

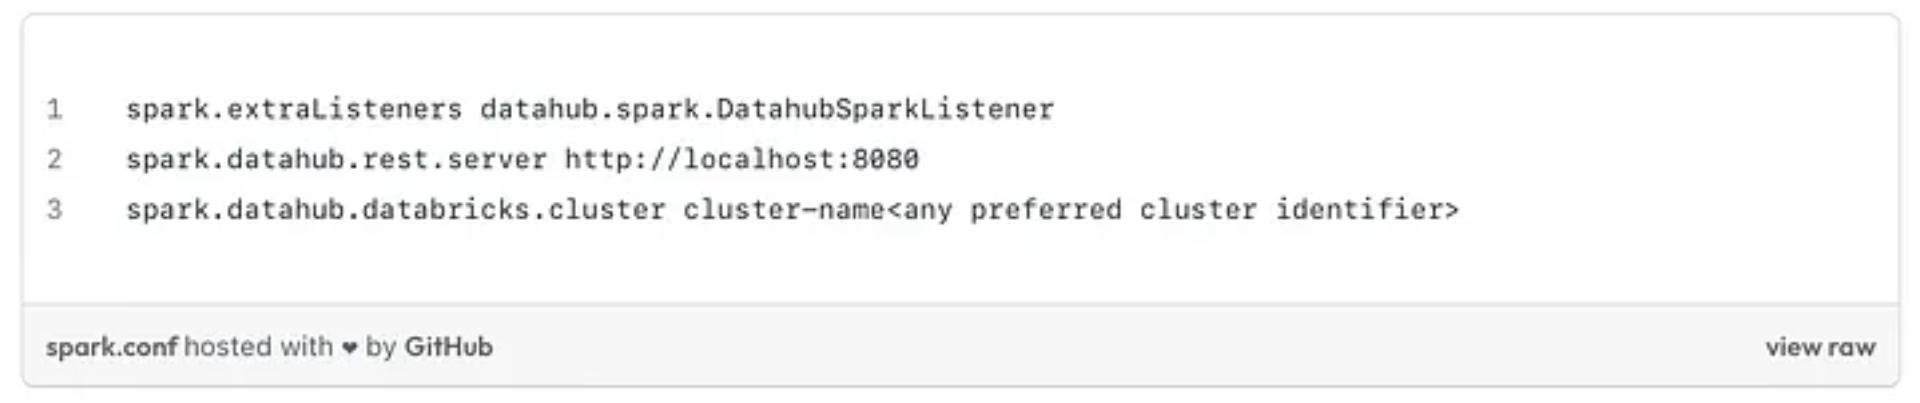
Databricks Cluster configuration
Ingest metadata to the data catalog
- Update the ingestion recipe to the following recipe.

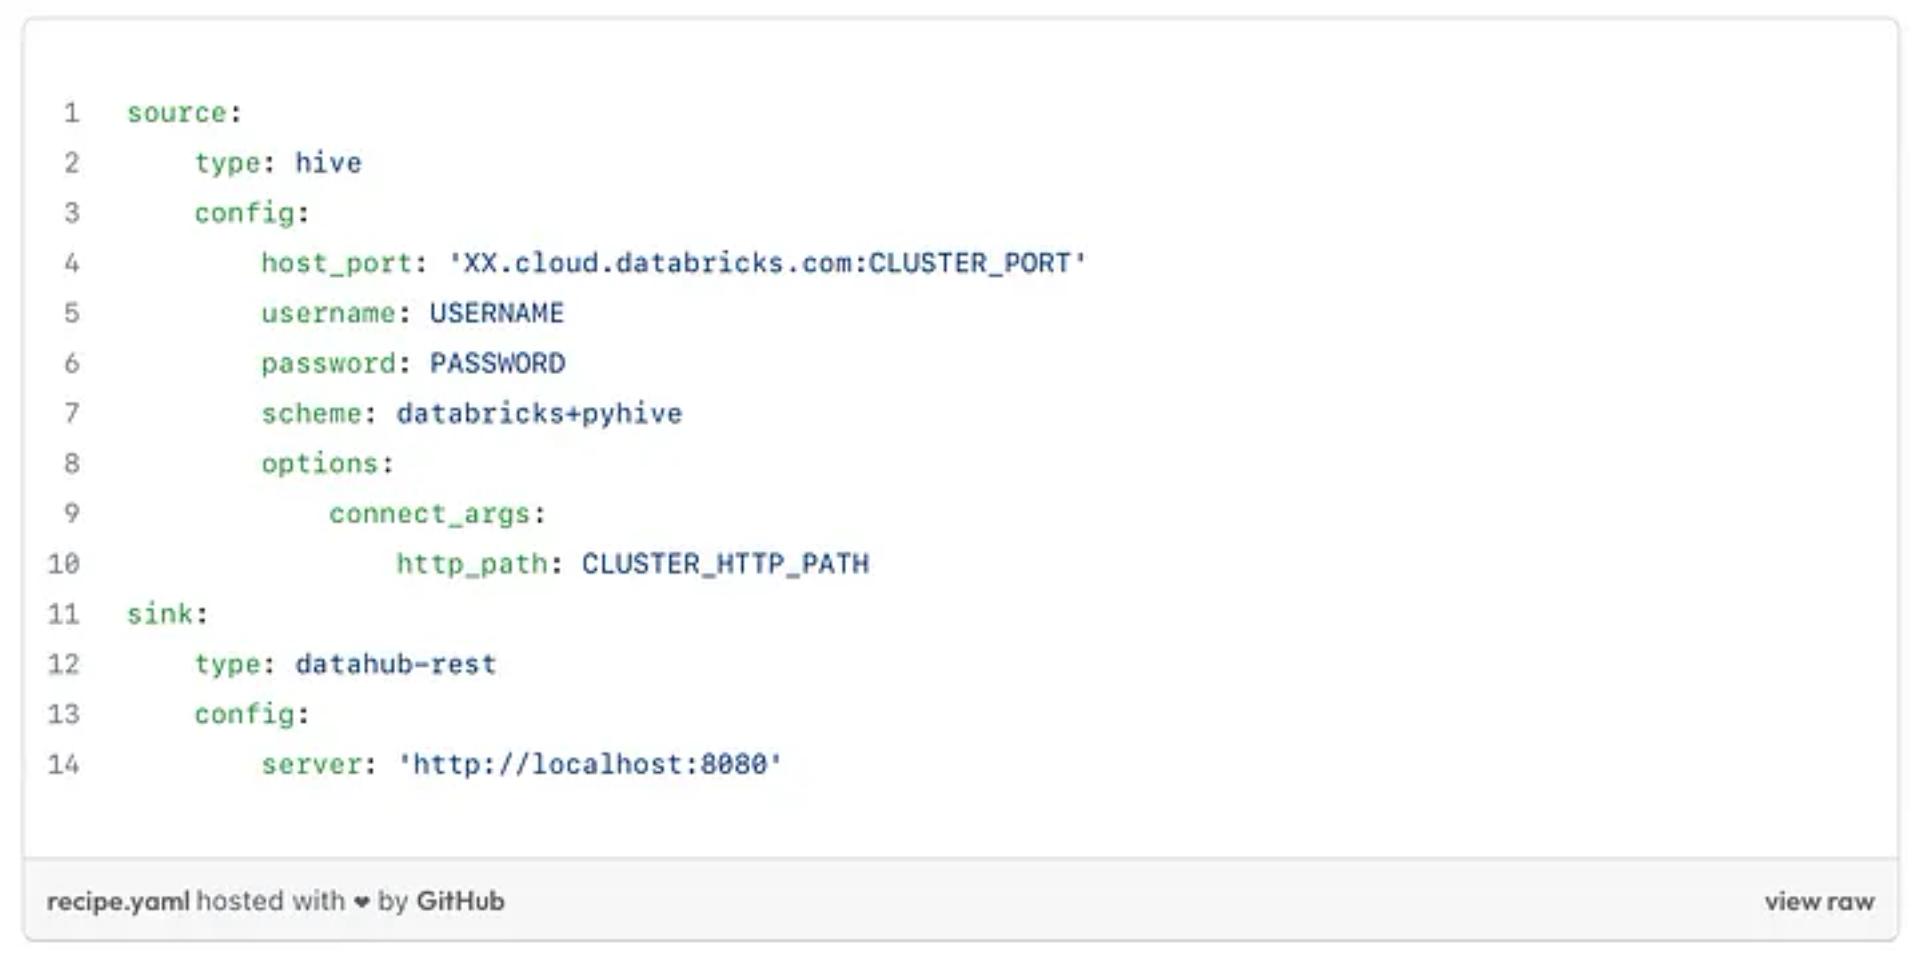
Ingestion recipe from Databricks to DataHub
- Then, run the following CLI command in your terminal:
dataHub ingest -c recipe.yaml
- Lastly, check the DataHub frontend, to see if the data was ingested correctly.

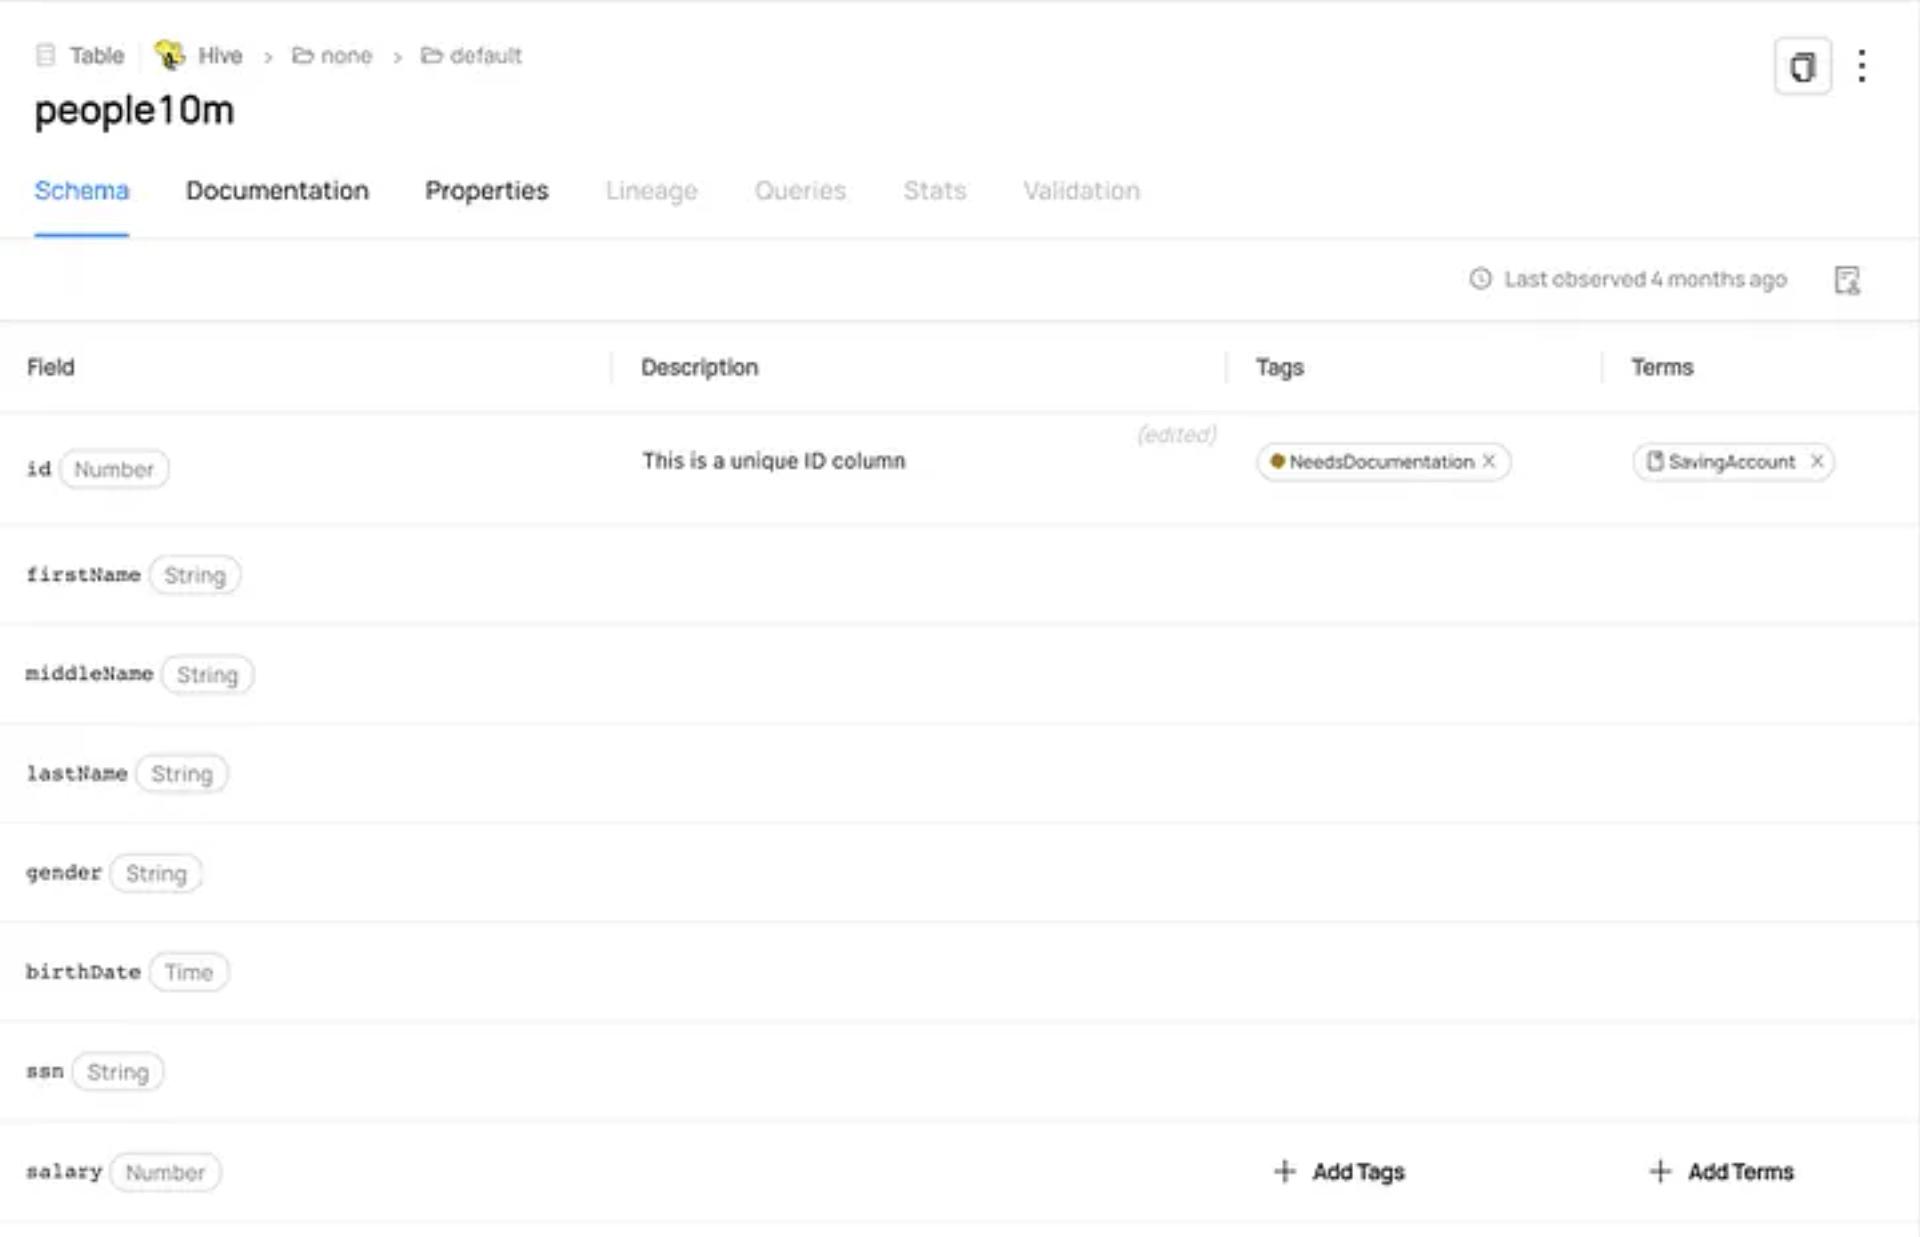
Ingested Dataset from Databricks (sample people 10m dataset)
What we learned
The good
- DataHub is a promising tool with multiple functionalities that are ready-to-use
- The set-up is very easy
- It is an open-source project with a big, invested dev community
- It has existing connectors for various databases and tools (dbt, Airflow, great_expectations)
- The User Analytics page is quite helpful to understand the behavior of the data catalog users
- A self-hosted demo instance to use their interface beforehand
- Support for Unity Catalog was just released, we are looking forward to trying it out.
The bad
- The configuration to ingest data from a Databricks is still a bit hacky and still hasn’t matured enough to be deployed in production environments, if you want to use it I would suggest waiting a little bit and paying attention to their releases
- The lineage wasn’t available for Databricks cluster, but it can be set-up for other data sources
All in all, DataHub seems like a promising tool with a bright future ahead of it, and I can not wait to try it in another use case to discover more of its potential.
Thank you Imane and the Sicara Team for writing this excellent walk-through!
Interested in becoming a contributor to the DataHub Blog?
Inspire others and spark meaningful conversations. The DataHub Community is a one-of-a-kind group of data practitioners who are passionate about building enabling data discovery, data observability, and federated data governance. We all have so much to learn from one another as we collectively address modern metadata management and data governance; by sharing your perspective and lived experiences, we can create a living repository of lessons learned to propel our Community toward success.
Check out more details on how to become a DataHub Blog Contributor, we can’t wait to speak with you! 👋
DataHub Community
Data Engineering
Community
Open Source
Databricks

NEXT UP
Governing the Kafka Firehose
Kafka’s schema registry and data portal are great, but without a way to actually enforce schema standards across all your upstream apps and services, data breakages are still going to happen. Just as important, without insight into who or what depends on this data, you can’t contain the damage. And, as data teams know, Kafka data breakages almost always cascade far and wide downstream—wrecking not just data pipelines, and not just business-critical products and services, but also any reports, dashboards, or operational analytics that depend on upstream Kafka data.

When Data Quality Fires Break Out, You're Always First to Know with Acryl Observe
Acryl Observe is a complete observability solution offered by Acryl Cloud. It helps you detect data quality issues as soon as they happen so you can address them proactively, rather than waiting for them to impact your business’ operations and services. And it integrates seamlessly with all data warehouses—including Snowflake, BigQuery, Redshift, and Databricks. But Acryl Observe is more than just detection. When data breakages do inevitably occur, it gives you everything you need to assess impact, debug, and resolve them fast; notifying all the right people with real-time status updates along the way.


John Joyce
2024-04-23

Five Signs You Need a Unified Data Observability Solution
A data observability tool is like loss-prevention for your data ecosystem, equipping you with the tools you need to proactively identify and extinguish data quality fires before they can erupt into towering infernos. Damage control is key, because upstream failures almost always have cascading downstream effects—breaking KPIs, reports, and dashboards, along with the business products and services these support and enable. When data quality fires become routine, trust is eroded. Stakeholders no longer trust their reports, dashboards, and analytics, jeopardizing the data-driven culture you’ve worked so hard to nurture
John Joyce
2024-04-17